Dashboard Insights
Dashboard Insights
All insights below are derived directly from complaints.csv (542 complaints, North Carolina, January 2024 – April 2026). No values are fabricated or estimated.
Chart 1: Complaint Volume by Company (Top 10)
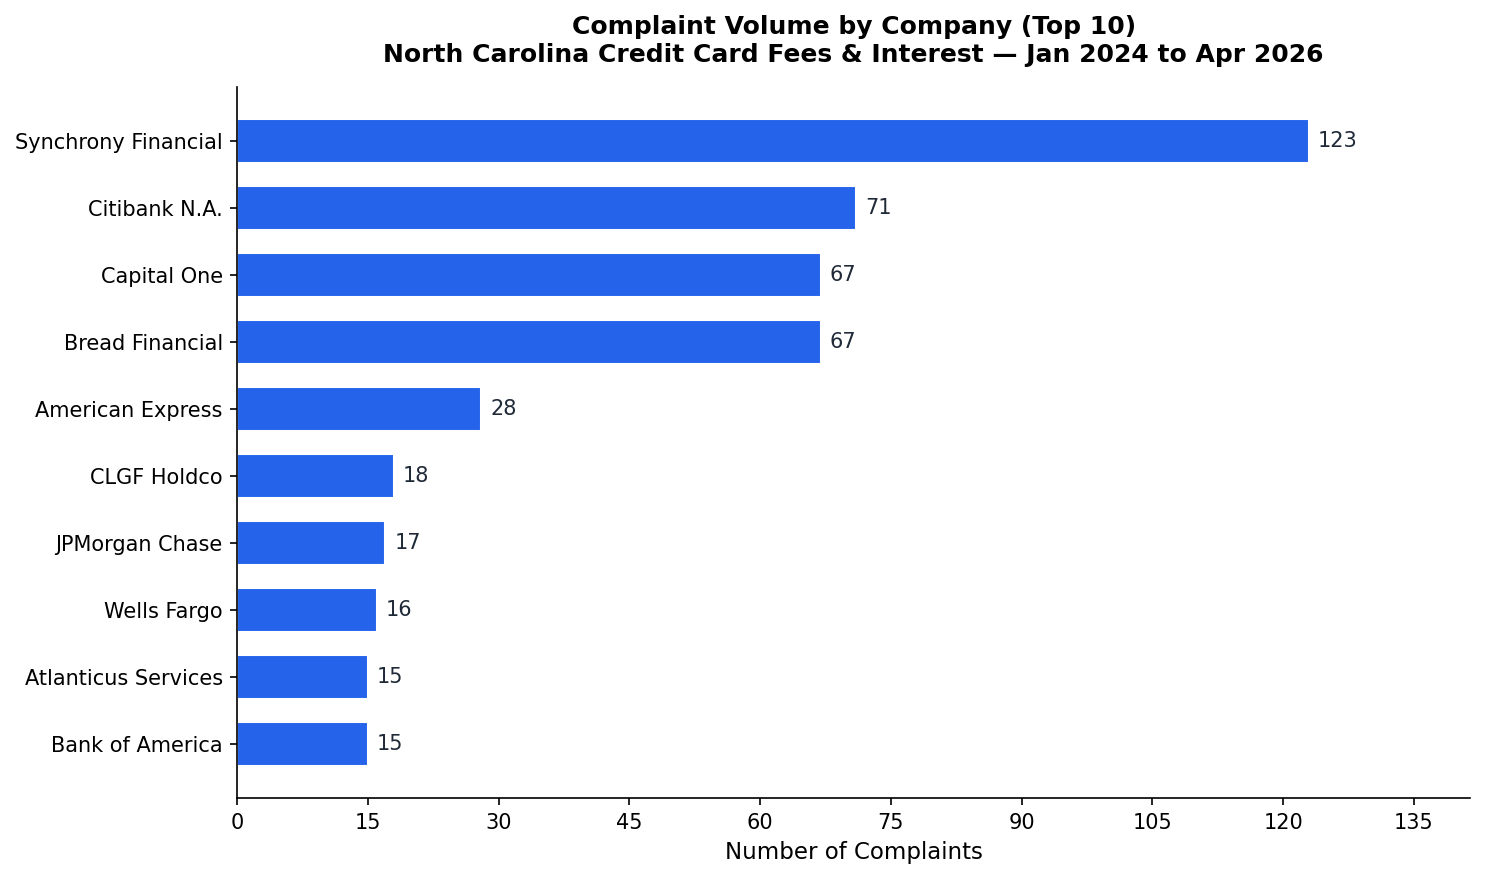
Business Interpretation: Synchrony Financial accounts for 123 complaints — 22.7% of all complaints in this dataset — making it the single largest source of credit card fee and interest complaints from North Carolina consumers. Citibank N.A. (71) and Capital One (67) follow, with Bread Financial Holdings (67) tied for third. The top four companies together represent 328 complaints, or 60.5% of the total dataset. This concentration suggests that a small number of large issuers drive the majority of consumer friction in this category. Regulators and consumer advocates may find it useful to focus engagement efforts on these top issuers first.
Chart 2: Sub-Issue Distribution
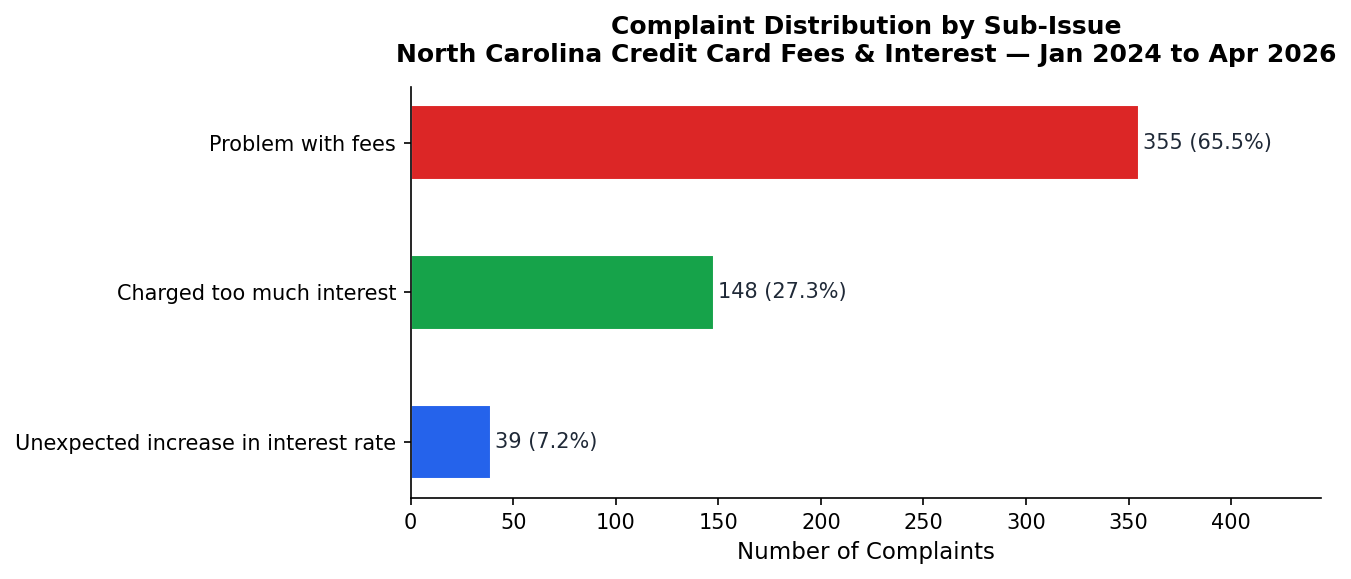
Business Interpretation: “Problem with fees” is the dominant sub-issue, accounting for 355 complaints (65.5% of the dataset). “Charged too much interest” represents 148 complaints (27.3%), and “Unexpected increase in interest rate” accounts for 39 complaints (7.2%). The overwhelming dominance of fee-related complaints suggests that consumers in North Carolina are most frequently disputing specific fee charges rather than general interest rate levels. This distinction is important for product teams and compliance officers: fee transparency and dispute resolution processes may be higher-priority improvement areas than interest rate communication.
Chart 3: Company Response Outcome Distribution
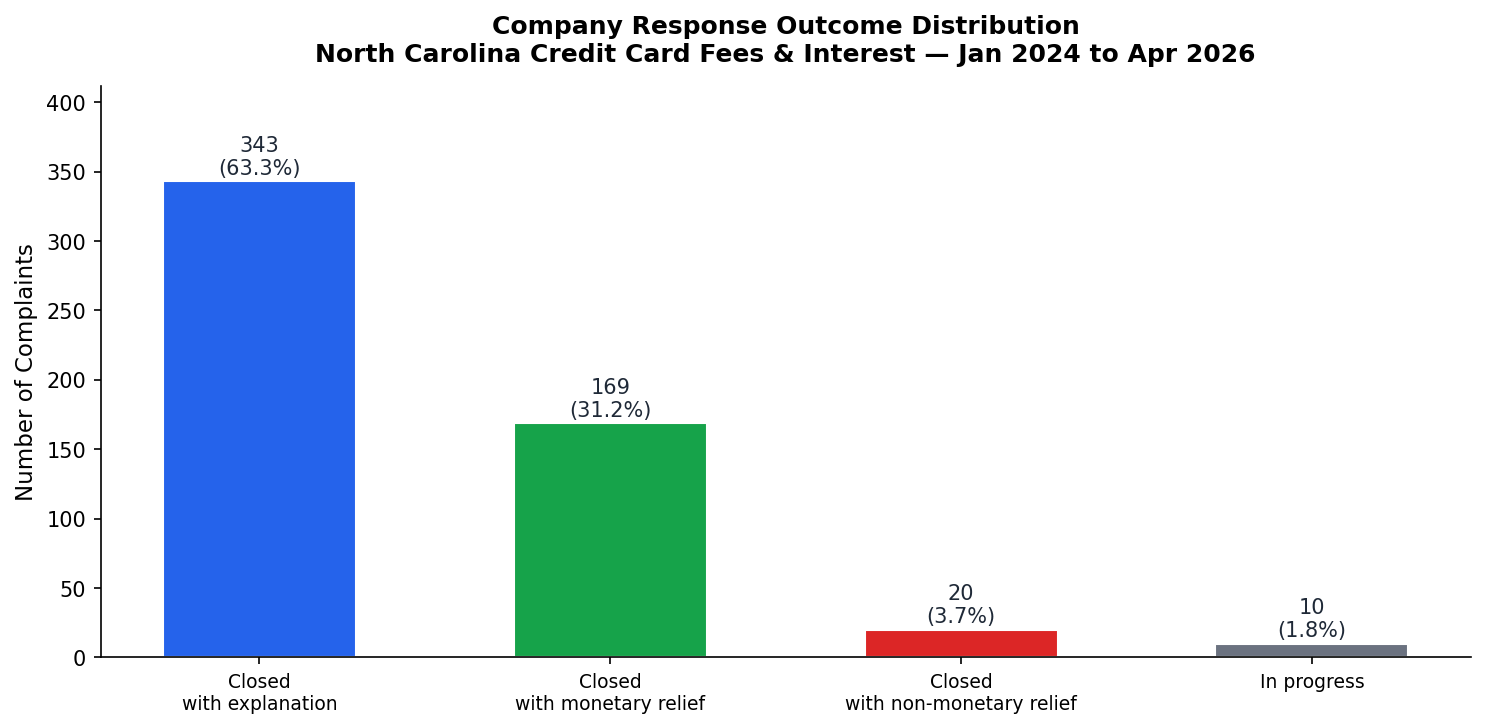
Business Interpretation: 343 complaints (63.3%) were closed with an explanation only — meaning the company responded but provided no financial remedy. 169 complaints (31.2%) resulted in monetary relief, indicating that nearly one in three consumers who filed a complaint received some form of financial compensation. 20 complaints (3.7%) were closed with non-monetary relief (e.g., account corrections, policy changes), and 10 complaints (1.8%) remain in progress as of the dataset’s end date. The high rate of explanation-only closures may indicate that many complaints are resolved through clarification rather than error correction, though it could also reflect companies defending their fee practices.
Chart 4: Monthly Complaint Volume Trend
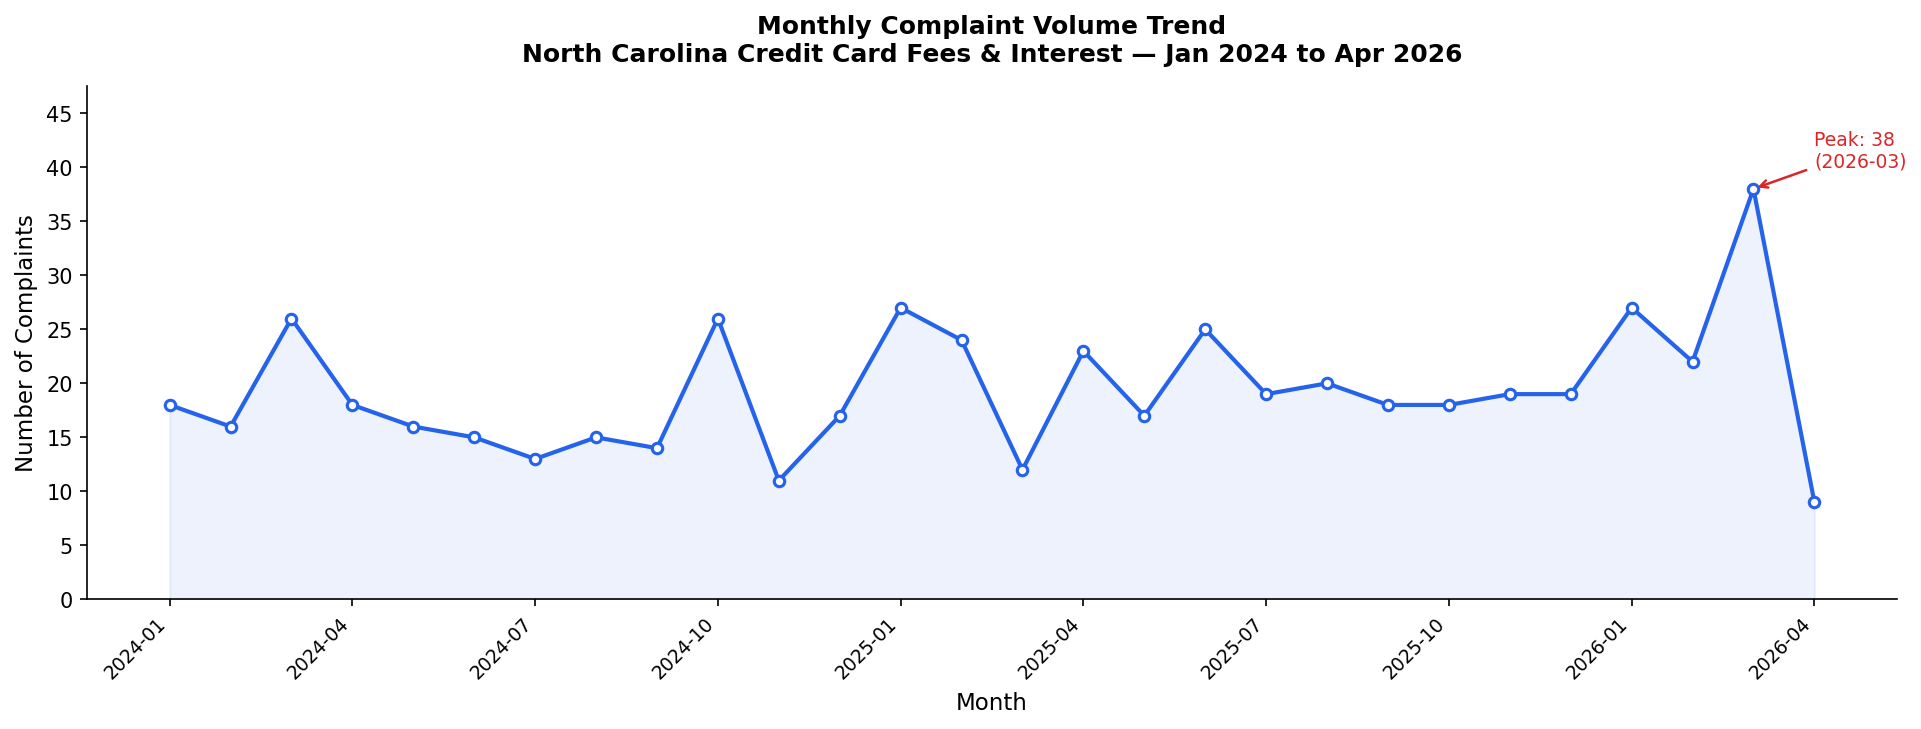
Business Interpretation: Complaint volume fluctuates between 9 and 38 per month over the 28-month period. The peak month is March 2026 with 38 complaints — notably higher than the dataset average of approximately 19.4 complaints per month. January 2025 and January 2026 both show elevated volumes (27 complaints each), suggesting a possible seasonal pattern where complaints increase at the start of the calendar year, potentially tied to year-end billing cycles, annual fee charges, or post-holiday credit card usage. The April 2026 count (9) is low because the dataset ends mid-month. Overall, the trend does not show a dramatic upward or downward trajectory, suggesting relatively stable complaint rates over the analysis period.
Chart 5: Timely Response Rate
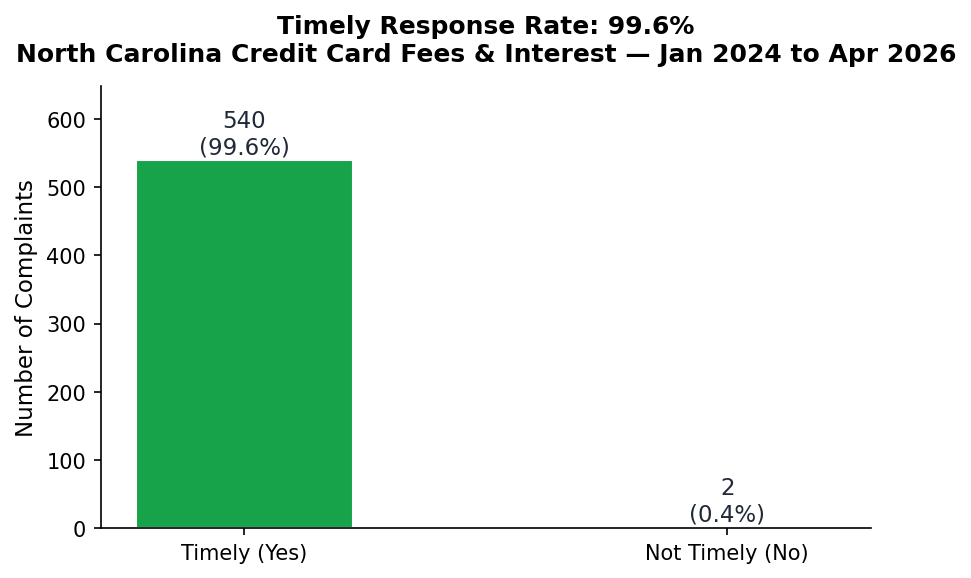
Business Interpretation: 540 out of 542 complaints (99.6%) received a timely response from the company within the CFPB-required timeframe. Only 2 complaints (0.4%) were flagged as not timely. This near-perfect timely response rate indicates that the financial institutions in this dataset are highly compliant with CFPB response deadlines. While this is a positive operational metric, it does not reflect the quality or consumer satisfaction of the response — a complaint can be closed “timely” with an explanation that the consumer finds unsatisfactory.
Chart 6: Narrative Keyword Theme Frequency
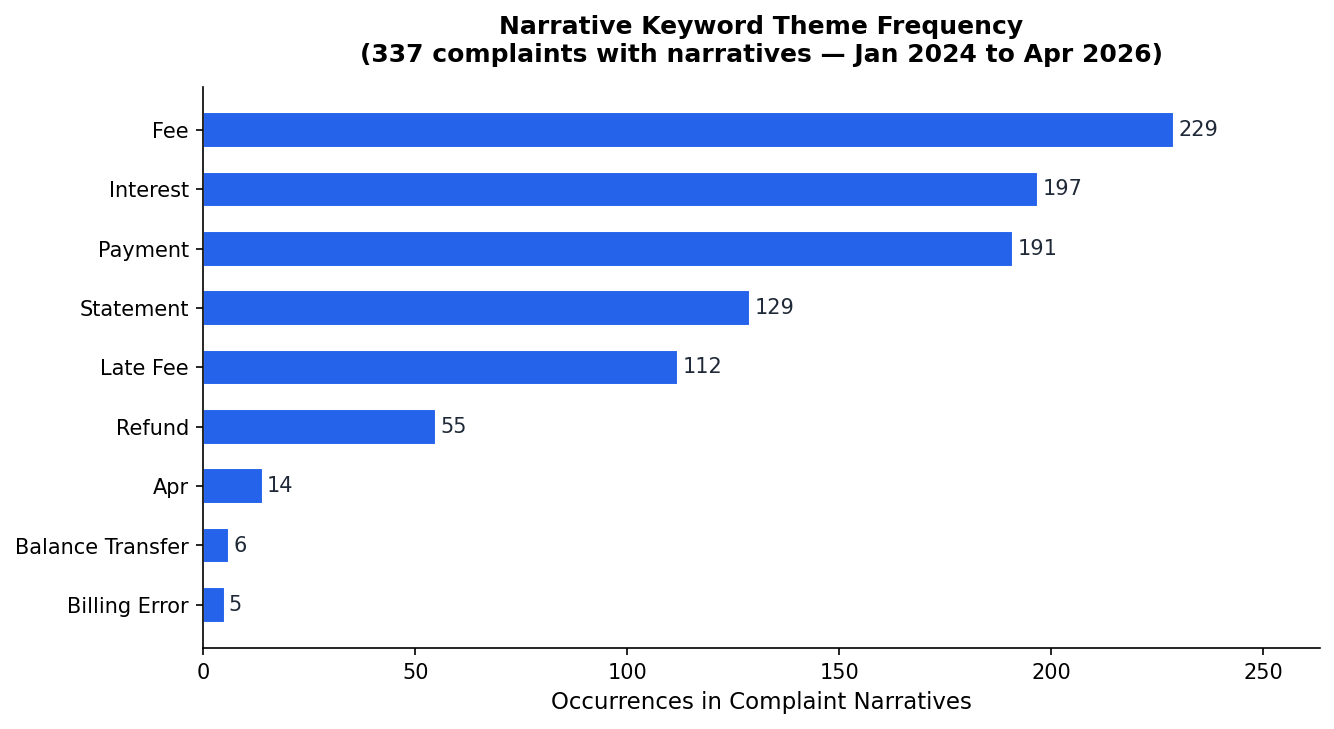
Business Interpretation: Among the 337 complaints that include a consumer narrative, “fee” appears in 229 narratives (68.0%), “interest” in 197 (58.5%), and “payment” in 191 (56.7%). “Statement” appears in 129 narratives (38.3%) and “late fee” in 112 (33.2%). These keyword frequencies confirm that fee disputes and interest charges are the primary friction points described in consumers’ own words. The relatively low frequency of “APR” (14 occurrences) and “balance transfer” (6 occurrences) suggests that consumers tend to describe their issues in plain language rather than financial terminology. “Promotional rate” appears in 0 narratives, indicating this is not a significant theme in this dataset.